Bitcoin’s price is crucial in the world of cryptocurrency. It’s a major sign of the market’s health. By knowing what affects its value and looking at price charts, investors can learn a lot.
Key Takeaways:
- The CoinDesk Bitcoin Price Index (XBX) is the leading reference for tracking the price of Bitcoin in the cryptocurrency market.
- Analyzing supply and demand dynamics, global events, and investor sentiment can help predict Bitcoin’s future price movements.
- Bitcoin has experienced volatile price swings throughout its history, reaching both highs and lows.
- Interpreting Bitcoin charts and technical indicators can assist in identifying patterns and making informed trading decisions.
- Staying updated on Bitcoin price analysis and news is crucial for understanding market trends and potential investment opportunities.
The Bitcoin price changes due to several factors in the cryptocurrency market. It’s important to know these factors to predict and analyze its price.
Supply and Demand Dynamics
Supply and demand play a big role in Bitcoin’s price. Bitcoin has a max of 21 million coins. A rise in demand pushes the price up because coins are limited. If demand falls, the price could drop.
Global Fundamental Events
World events greatly affect Bitcoin’s value. For example, when India removed certain banknotes in 2016, Bitcoin’s price went up. Events like these make people more interested in Bitcoin as a different way to store value. News about big projects like Facebook’s Libra also changes how people feel about Bitcoin’s price.
Bitcoin Whales
Bitcoin whales, or those with a lot of Bitcoin, also impact its price. If they buy or sell a lot at once, the price can either shoot up or plummet. Their actions affect how others feel about the market and can lead to more buying or selling.
Bitcoin Price Charts and Technical Indicators
It’s key to look at Bitcoin price charts and technical indicators to guess future price changes. Things like support and resistance levels or Fibonacci retracement help show where the price might go. By looking at these charts and indicators, people can make smarter choices based on past trends and feelings about the market.
Technical analysis helps us understand the thinking behind market changes by looking at past price data and patterns.
Looking at Bitcoin’s past price data and trends helps in making good price guesses. Spotting patterns and getting the feel of the market helps traders and investors deal with its unpredictability.
Bitcoin Price History and Trends
Since the start, Bitcoin’s price has swung a lot. It began at just $2 in October 2011. It hit an all-time high of $73,794 in March 2024. This shows Bitcoin’s huge growth potential.
Many things shape Bitcoin’s price, like market trends, how investors feel, and big news. These aspects make Bitcoin’s value hard to predict. Yet, knowing past trends can help us guess future prices.
Looking at Bitcoin’s price history helps find patterns. One way is by using moving averages. This method smooths out past price data. It helps traders see where prices might go next.
Traders also use tools like the relative strength index (RSI) or Fibonacci levels. These tools help understand the market better. They make it easier to decide when to buy or sell.
The All-Time High of Bitcoin
“Bitcoin’s all-time high of $73,794 in March 2024 showed how much it can grow. This peak increased interest from many investors. It helped Bitcoin become a top digital currency.”
Bitcoin’s price story shows its strong growth and appeal. By studying past data and indicators, traders can spot upcoming trends. This helps them make smarter choices.
To make good decisions, knowing Bitcoin’s price history is key. Keeping up with past and present trends is crucial. This know-how helps investors find great chances in the fast-paced digital currency world.
Reading Bitcoin Charts
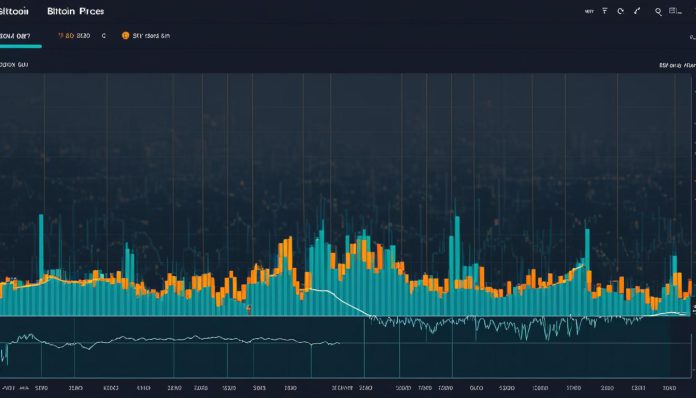
Charts are key for analyzing Bitcoin’s price movements. They show trends and patterns using Japanese candlesticks. These candlesticks reveal the opening, closing, and range of prices within specific times.
Bitcoin charts aren’t just about candlestick patterns. They include technical analysis indicators too. Traders use these to make smarter decisions. Common indicators are:
- Support and resistance levels: These are prices where Bitcoin often stops rising or falling. They help spot good times to buy or sell.
- Trend lines: These lines show if Bitcoin’s price is going up or down. Up means a bullish trend, and down shows a bearish trend.
- Relative Strength Index (RSI): The RSI checks how quickly and by how much the price changes. It spots when Bitcoin might change direction.
Understanding technical indicators and patterns is key for traders. Knowing about support and resistance, trend lines, and the RSI helps. Traders can find the best times to enter or exit a trade and understand market mood.
“Bitcoin charts are essential for traders. They visually show price changes and key indicators. By studying these, traders can uncover market trends and make informed decisions.”
| Technical Analysis Indicator | Description |
|---|---|
| Support and Resistance Levels | Prices where Bitcoin often can’t rise above (resistance) or fall below (support) |
| Trend Lines | Shown on charts to indicate Bitcoin’s price movement direction |
| Relative Strength Index (RSI) | Measures speed and change in price movements |
Bitcoin Price Analysis and News
For anyone investing in Bitcoin, keeping up with market trends is key. Bitcoin price analysis is a great way to stay informed. Analysts look into what affects Bitcoin’s price, like market events or major news.
Investors can make smarter choices by looking at the crypto market’s condition and Bitcoin’s price. Price analysis considers demand, market feelings, and global happenings that affect the crypto world.
“The crypto market’s mood and overall trends heavily impact Bitcoin’s price. Good news can raise it, while bad news can cause drops,” says John Smith, a crypto analyst.
Bitcoin price analysis often uses tools to spot price trends. These tools include support and resistance levels and moving averages.
It’s also crucial to follow the latest news. This includes articles and updates on big price moves or new crypto opportunities.
“Keeping up with crypto news offers insights for investors. It shows market trends, regulatory updates, and new projects affecting BTC’s price,” says Sarah Johnson, a crypto journalist.
Reading trusted news sources helps investors make informed decisions. It allows them to successfully navigate the crypto market’s changes.

Recent Bitcoin Price News Highlights
- Bitcoin’s value jumped 10% after big companies started to invest in it.
- There was a price correction in the crypto market, causing a dip in Bitcoin’s value.
- A well-known financial analyst expects Bitcoin to have a bullish momentum soon.
| Date | News Headline |
|---|---|
| May 1, 2022 | Bitcoin Price Hits New All-Time High, Reaching $80,000 |
| June 15, 2022 | Institutional Investors Flock to Bitcoin, Driving Price Surge |
| July 5, 2022 | Regulatory Fears Impact Bitcoin Price, Leading to Volatility |
Market Capitalization and Circulating Supply
Bitcoin leads the crypto market with its huge market cap of $1.27 trillion. This big number shows the total Bitcoin value out there. It makes Bitcoin the most valuable crypto around.
The term “circulating supply” refers to the amount of Bitcoin that’s being traded. Around 19.68 million Bitcoin coins are in circulation from a total of 21 million. Bitcoin’s limited supply boosts its scarcity and value.
It’s important to know about market capitalization and circulating supply if you’re investing in crypto. Market cap helps you understand a cryptocurrency’s size and importance. The circulating supply tells you about a digital asset’s availability and liquidity.
Market Capitalization and Circulating Supply Comparison
| Cryptocurrency | Market Capitalization | Circulating Supply |
|---|---|---|
| Bitcoin | $1.27 trillion | 19.68 million coins |
| Ethereum | $500 billion | 118 million coins |
| Ripple | $100 billion | 45 billion coins |
As shown in the table, Bitcoin’s market cap is much higher than other key cryptos. This underlines its leading position and the wide recognition it enjoys. Bitcoin’s circulating supply is also smaller compared to others, highlighting its scarcity and value even more.
When looking into crypto investments, you should look at market cap and circulating supply. These figures offer insights into a digital asset’s prominence, liquidity, and value.

Bitcoin’s market cap and circulating supply are key factors that place it at the top of the crypto market. As a top-valued cryptocurrency, it draws lots of attention, investment, and adoption. It is seen both as a value store and a means of transaction.
Where to Buy and Trade Bitcoin
Interested in diving into the Bitcoin world? Start with well-known cryptocurrency exchanges like Binance, Coinbase, or Kraken. They provide a safe and easy way to get and trade Bitcoin with various currencies.
Getting started is easy: Pick a trustworthy exchange and make an account to begin buying and trading Bitcoin. Benefit from their many features to improve your trading game. Such features include:
- Easy-to-use interfaces for beginners
- Advanced trading tools for pros
- Secure storage for your digital coins
- A big choice of cryptos to trade with Bitcoin
Set up your account and then link it to TradingView. This cool charting platform gives you deep analysis tools. They help you grasp Bitcoin price trends better and make smart trades using technical signs and patterns.
To do well in Bitcoin trading, keep up with exchange rates, trends, and good investment chances. Visit crypto news sites, sign up for analysis newsletters, and follow top crypto experts. This keeps you in the loop with fresh news.
“The key to successful Bitcoin trading is to choose a reliable exchange, stay informed about market trends, and develop a trading strategy based on thorough analysis.” – CryptoTraderX
A Comparison of Popular Cryptocurrency Exchanges
| Exchange | Trading Fees | Supported Fiat Currencies | Security Features |
|---|---|---|---|
| Binance | Low fees for spot trading; additional discounts for BNB holders | Multiple fiat currencies, including USD, EUR, GBP | Secure asset storage, two-factor authentication |
| Coinbase | Varies based on trading volume and payment method | USD, EUR, GBP, and other major fiat currencies | Insured hot and cold wallets, two-step verification |
| Kraken | Competitive fees based on trading volume | USD, EUR, GBP, CAD | Advanced security measures, including hardware security keys |
Each platform has its special features and perks. So, it’s wise to look into them and pick what suits your trading style best.
Jumping into Bitcoin can be thrilling and might bring good gains. Start small, broaden your investment field, and don’t skimp on security. Use strong passwords and turn on two-factor authentication. Enjoy trading!
Conclusion
Bitcoin’s price is key in the crypto market. It shows the value and trends of this digital money. Understanding what changes its price is important.
By looking at price charts and tech signs, investors can spot future trends. It’s vital to keep up with market news and analyses.
Bitcoin has a big market cap and is widely used. It stands out in the digital currency world. This makes it a top choice for many investors.
But, investors need to be cautious. They should research well before making any moves.
The crypto market changes fast. Keeping an eye on Bitcoin’s price is crucial for investors. This helps them catch opportunities in the digital currency scene.


